Relations Between Data, KPI and EBM for SaaS Business
Why Do I Need to Gather Data?
Data has become the lifeblood of modern business operations. Whether you run a startup or a large corporation, gathering data allows you to make informed decisions that can significantly impact your bottom line. Sample uses of data are:
- Informed decision-making: without data, decisions are often based on assumptions or gut feelings, which can lead to costly mistakes. Data-driven decisions are backed by evidence, reducing risk and enhancing the likelihood of success.
- Customer insights: data helps businesses understand who their customers are, their behaviors, preferences, and how they interact with your product or service. This understanding is vital for personalizing offerings, improving customer experience, and boosting retention.
- Operational efficiency: gathering data on internal processes can reveal inefficiencies or bottlenecks. This enables businesses to streamline operations, reduce costs, and improve overall productivity.
- Measuring performance: businesses that track KPIs (Key Performance Indicators) can measure success more accurately. Data helps identify areas for improvement and pinpoint what’s working well.
- Avoiding issues and bottlenecks: well chosen KPIs and their acceptable levels can serve an safety valve for various aspects of businesses. This is best paired with trend-based alerts.
In short, collecting data equips businesses with the knowledge needed to adapt to market changes and achieve sustainable growth. Although, you need to keep in mind that it cannot be just ANY data and it cannot be just ANY KPIs – but we will consider this aspects later on.
What Is KPI and How to Use It to Grow?
A Key Performance Indicator is a measurable indicator for value that presents how effectively a company is achieving its objectives. KPIs can be applied to different areas, such as financial performance, customer satisfaction, operational efficiency, or employee engagement. But how can you use KPIs to grow your business?
- Set SMART Goals: KPIs should align with your business goals and be Specific, Measurable, Achievable, Relevant, and Time-bound (SMART). This helps ensure that each KPI is meaningful and actionable.
- Track Performance Regularly: KPIs are not meant to be static. To grow your business, regularly review your KPIs to understand trends, identify strengths, and address weaknesses.
- Use KPIs for Accountability: KPIs help create a culture of accountability by giving teams clear performance metrics. Employees know what is expected of them, which drives focus and productivity.
- Make Adjustments: If you notice that certain KPIs are not improving, take corrective actions. This could mean adjusting your strategy, changing your approach, or allocating resources differently.
KPIs provide a road map for business growth by highlighting areas that need attention and guiding decision-making with clear, objective data. And at this point you might get invalid feeling, that “in such case the more KPIs, the better” – that’s not true. Same as in investing – too many indicators can actually obscure true condition of business. So select those wisely.
What Is Evidence-Based Management?
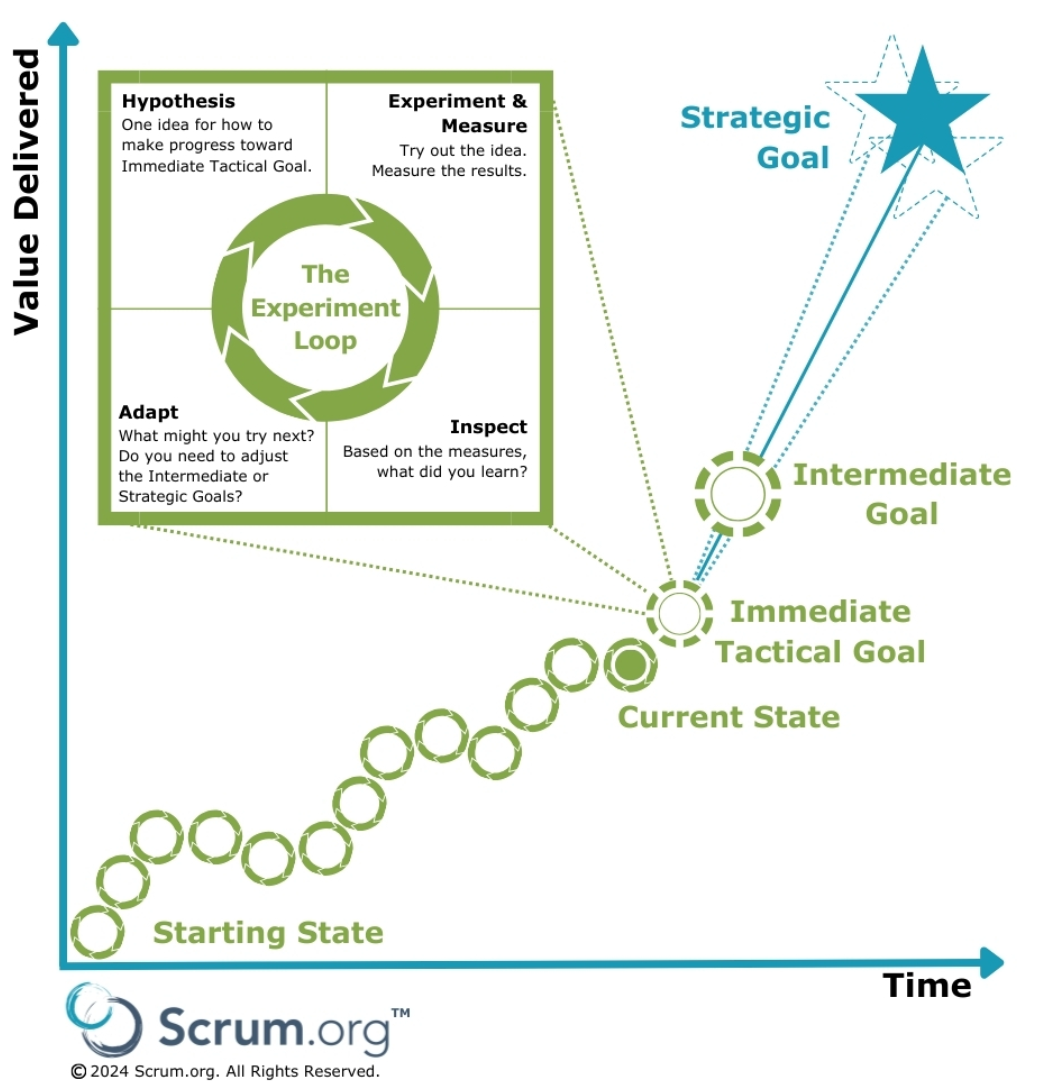
Evidence-Based Management (EBM) is a management approach that relies on empirical data, facts, and evidence to make business decisions. Unlike traditional management practices that might rely on instinct, EBM focuses on gathering and analyzing data to determine the best course of action. By learning this definition you might actually already feel how compatible EBM and KPIs are, and in fact it will be probably even more visible to you if you take a look at this schema straigth from EBM Guide.
At Sailing Byte, we emphasize the importance of EBM. As a PAL-EBM certificate holder, I have a deep understanding of how to apply this framework in various business contexts. Here’s why EBM is a game-changer:
- Data-Driven Decision Making: EBM reduces reliance on guesswork, empowering businesses to base decisions on real-world evidence.
- Continuous Improvement: EBM encourages constant feedback and learning loops. By regularly reviewing evidence, businesses can refine processes and strategies over time.
- Reducing Risk: Decisions backed by data are more likely to lead to favorable outcomes, minimizing the risk of costly errors.
Sailing Byte uses EBM practices to help clients drive success by grounding their strategies in solid evidence rather than assumptions. To deepen my knowledge and provide better solutions for my clients, I decided to participate in PAL-EBM certification program, thus now I am proud holder of PAL-EBM official certificate by scrum.org. So during paid workshops feel free to ask me any questions regarding this topic and I shall answer!
What Areas Should KPIs Cover?
If I say that “every area” it will be too vague and too costly to track. On the other hand if I say “most important areas”, then there might be important aspects that are ommited. To find a blance between these two, you need a bit of holistic description of business – that’s where business lean canvas comes in handy. Essentially, looking at it you might already “feel” what makes sense to measure and what does not. It may differ a bit for your case, but essentially since BMC and LC should cover business throught, you should be able to identify crucial areas.
For business model canvas:
- Customer segments and channels – you can measure for example conversion ratio for any channel at any stage
- Value proposition – the practical relevance for the users
- Customer relationships – you can measure NPV, number returning customers, LTV
- Revenue streams and Cost structure – you can focus on basic costs such as cashflow or EBIDTA
- Key resources, key activities, key partners – most probably these assets should just probably increase their value or amount
For lean canvas:
- Replace Key partners with Problems, Replace Key activities with Solutions, Replace Key resources with Key metrics – and essetially what’s crucial that you get out of it is “key metrics”. Because if you have put your heart in making lean canvas, then actually you already have KPIs defined.
- Replace Customer relationships with Unfair advantage – but I don’t think it adds any additional KPI’s
Based on the list above you could generate list KPI’s and give them some hierarchy. This way you can have fast and easy view on high level business health (of course if KPIs are general enough and well chosen) and if you want to deep dive into each category you can look for KPIs specific for given category. For small online business I would suggest following areas:
- Financial – because you need to know if you are not running out of money and if business is profitable
- Customer – because you need to know if customer is happy and if customer base is growing
- Operational – because it gives you insight if internal processes are all right
- Marketing – because it allows you to asses best marketing channels
For each of these categories I will aim to provide you with: general one or two metrics, some specific metrics, and potential tools to measure outcome. As a reminder here is sample Lean Canvas:
Choosing KPIs and Tools for Online Business
Financial Stability
Financial stability is very important at any stage of development, and actually in my opinion it reflects health of all the other business areas if measured honestly. You could argue with that, but in my opinion most important is cashflow. If cashflow is positive, then most probably general direction of business is good – because you are growing. Just keep in mind that cashflow should be measured properly – consider how you actually should calculate things such as loans or funding rounds so this indicator does not loose it’s meaning. If you think that it is not reflecing properly business growth stability, then maybe you should consider some other indicator.
Another good general indicatior might be net profit which is total profit after expenses. I think this does not require any more explanation.
It is helpful to keep one banking account for business to keep everything in one place. This way you may just export data once a month to excel or some other database and calculate all financial factors. More advanced indicators that you can consider would be:
- Net profit margin
- Gross profit margin
- Revenue growth rate
- Return on investment (ROI)
- Cashflow forecast
Customer Relations
Understanding user behavior is key to optimizing customer experience and increasing retention. KPIs in this area should reflect whole user journey: from the very beginning of discovery of your service, to ending relation AND everythig in between (such as User Misery or User Experience).
Some KPIs for user behavior:
- Customer Retention Rate: Measures the percentage of customers who continue using your product over a set period.
- User Engagement Rate: Tracks how often users interact with your platform (e.g., page views, click-through rates).
- Customer Lifetime Value (CLV): Predicts the total value a customer will bring to your business over time.
- Churn Rate: Monitors the percentage of users who stop using your product or service.
Sample tools for tracking user behavior:
- Google Analytics: Provides insights into how users navigate your website and which pages are most popular.
- Hotjar/MS Clarity: Offers heatmaps and session recordings to visualize user interactions.
- Mixpanel: Helps track user engagement across web and mobile platforms.
These KPIs and tools offer valuable insights into how users are interacting with your product, enabling you to make data-driven adjustments to improve user experience.
Operational Measurements
In software development, tracking performance is essential for delivering high-quality products on time. Note that this may be different if you are using in-house or external software developers (in a way: different metrics will be important for you for those two different cases).
Sample KPIs for software development:
- Cycle Time: Measures the time it takes to complete a task, from start to finish.
- Sprint Burndown: Tracks the progress of work completed in an Agile sprint, ensuring teams meet deadlines.
- Code Quality: Monitors the health of the codebase through metrics like technical debt, bug count, and code complexity.
- Deployment Frequency: Assesses how often new features or fixes are released to production.
Tools for tracking software development:
- Jira: A project management tool designed to track tasks, issues, and bugs in Agile development.
- GitHub: A source control tool that allows teams to manage and review code changes efficiently.
- SonarQube: Analyzes code quality by identifying bugs, vulnerabilities, and code smells.
These KPIs and tools help ensure that your software development process remains efficient, predictable, and of high quality.
KPIs for Marketing
Paid advertising is a significant investment, and tracking its effectiveness is crucial for maximizing ROI. Note, that it also helps you to select most efficent channels – possibly helping you to select tool that is able to reach your target audience. Here are the KPIs and tools you can use to monitor your paid ad performance:
KPIs for paid ads:
- Click-Through Rate (CTR): Measures the ratio of users who click on your ad compared to those who see it.
- Conversion Rate: Tracks how many clicks convert into actual sales or leads.
- Cost Per Acquisition (CPA): Monitors the cost of acquiring one customer through paid advertising.
- Return on Ad Spend (ROAS): Measures the revenue generated for every dollar spent on advertising.
Tools for tracking paid ads:
- Google Ads: Offers detailed analytics on the performance of your search and display ads.
- Facebook Ads Manager: Provides insights into ad performance across Facebook and Instagram.
- HubSpot: Tracks ad spend and ROI across multiple channels.
By monitoring these KPIs and utilizing these tools, you can optimize your ad spend and ensure your campaigns are delivering the desired results.
Improve Data Collection, Tracking and Interpretation
Automating Business Processes in Aspect of Data Measurements
Automation is another critical aspect of modern business management. Automation helps businesses save time, reduce errors, and scale operations more efficiently. Here’s why it matters:
- Enhanced Efficiency: Automating routine tasks frees up your team to focus on high-value activities.
- Cost Reduction: Automation reduces the need for manual labor, cutting operational costs.
- Improved Accuracy: Automated processes minimize the risk of human error, improving data accuracy and consistency.
- Scalability: As your business grows, automation enables you to scale operations without significantly increasing overhead.
And you can think of why it is important in aspect of KPIs. You can see how many tools and how many data should you process to properly assess and calculate KPIs – this actually can be overwhelming. And there is no tool to fit all your needs, but there are some tools that can help you out with preparing this data, such as:
- N8N or Zapier which allows events processing and pushing data
- Influx or Airtable or Nocodb which helps to grather and keep data in one place
- Looker Studio which helps to report actual data in digestable manner
This are of course only samples, and selection of proper tools is not easy. It depends on where you get data from, what kind of data you need, how would you want it displayed and so on. Just remember to keep balance between data amount and complexity of tools. It is better to start of with one single indicator and try to add next, than trying to do all KPIs at once.
At Sailing Byte, we specialize in building automated systems that not only streamline operations but also integrate seamlessly with your existing business processes. Whether it’s automating marketing workflows or tracking KPIs, we ensure you have the tools needed to run a more efficient and profitable business.
The Role of AI in Business Performance Monitoring
Another transformative technology that businesses are leveraging is Artificial Intelligence (AI). AI helps in predicting trends, automating data analysis, and providing actionable insights for better decision-making.
- Predictive Analytics: AI can analyze historical data to predict future trends, helping businesses stay ahead of market shifts.
- Automated Reporting: AI can automate the generation of reports, providing real-time insights into business performance without manual intervention.
- Customer Support: AI-powered chatbots can provide immediate responses to customer inquiries, improving service efficiency.
- Integrating AI into your business processes allows for faster, more accurate analysis, giving you a competitive advantage.
If you have gathered data in one place that is readable by AI, it is possible that you can connect AI to this data so it can maybe help you identify aspects you wouldn’t think of. This of course raises question about business data privacy – which is in fact very valuable data. So you either need to read carefully terms of service or try to run MIT-licensed LLM on servers you can control.
How to Apply KPIs to EBM?
I think that at this point it should be clear – you can apply KPIs to EBM or vice versa – they complement each other in indespensible way. One aspect would be short term, and this is when your KPIs are following the path that you have established for short term goals – that is for example monthly goal or quarterly goal. Another aspect would be tracking down if you are on the course with long term goals – that is if you have one year or five time goal you can see if you are approaching this goal or not. Another thing great about EBM is that you take out all the emotions out of strategic thinking and you can simply find elements that do not bring you closer to your goal. You can also potentially enhance long term or short term goals if your KPIs are maybe doing better than you indicated – but if they are doing worse than indicated then it is easy to spot early where the issue is. If you understand this relation, you can bring most of it and quickly enhance your business.
Charting Your Course to Success with Sailing Byte
At Sailing Byte, we don’t just help you gather data—we help you turn that data into actionable insights. Whether through Evidence-Based Management, automated KPI tracking, or custom software solutions, we give you the tools to track your business aspects and introduce you to options that you can use to optimize it further. Remember that every optimization takes you a little bit ahead of competition, and this can be something that will decide how profitable your business can be.