
While business simulations is not a new idea, using AI (even in the LLM forms) is more archeivable now by medium and small businesses due to increasing availability and dropping AI cost. Such intersection of business modeling and artificial intelligence has created a pressing need for standardized, mathematically structured representations of business components that can be processed more effectively by Large Language Models (LLMs) than traditional narrative reports. While on one hand it seems that usage of such means is not necessary due to AI interpretation ability, on the other hand you can get undoubtly better outputs of your prompts if AI is not forced to interpret this data but gets it in structurized format.
In fact, due to computerization, digital business modelling is already present in our environment for some time already. So there are few ways that you can achieve making digital business representation, that can be useful for you, for board and for AI.
Note: in general I do avoid attaching AI-generated images, but for this article it was so tempting that I decided to make an exception.
What is a “Digital Twin” in Business Context?
Digital twins in business modeling are virtual representations of real-world business entities, processes, or systems that are continuously updated with live data. These models mirror the structure, behavior, and performance of their physical counterparts, enabling organizations to simulate, analyze, and predict outcomes in a dynamic environment. By integrating data from various sources—such as IoT sensors, enterprise applications, financial data and historical records—digital twins offer a holistic view of business operations, helping stakeholders and board members make informed decisions, identify inefficiencies, and test scenarios without disrupting actual workflows.
In the context of business modeling, digital twins go beyond static diagrams or spreadsheets by offering real-time, interactive models that evolve alongside the business. They enable organizations to visualize dependencies, monitor key performance indicators, and forecast the impact of strategic changes, such as introducing a new product line, identifying waste or restructuring a supply chain. When combined with AI and machine learning, digital twins become powerful tools for continuous improvement, risk mitigation, and innovation, making them essential for agile, data-driven decision-making in modern enterprises.
Ontological and Semantic Business Models
Business Model Ontology (BMO)
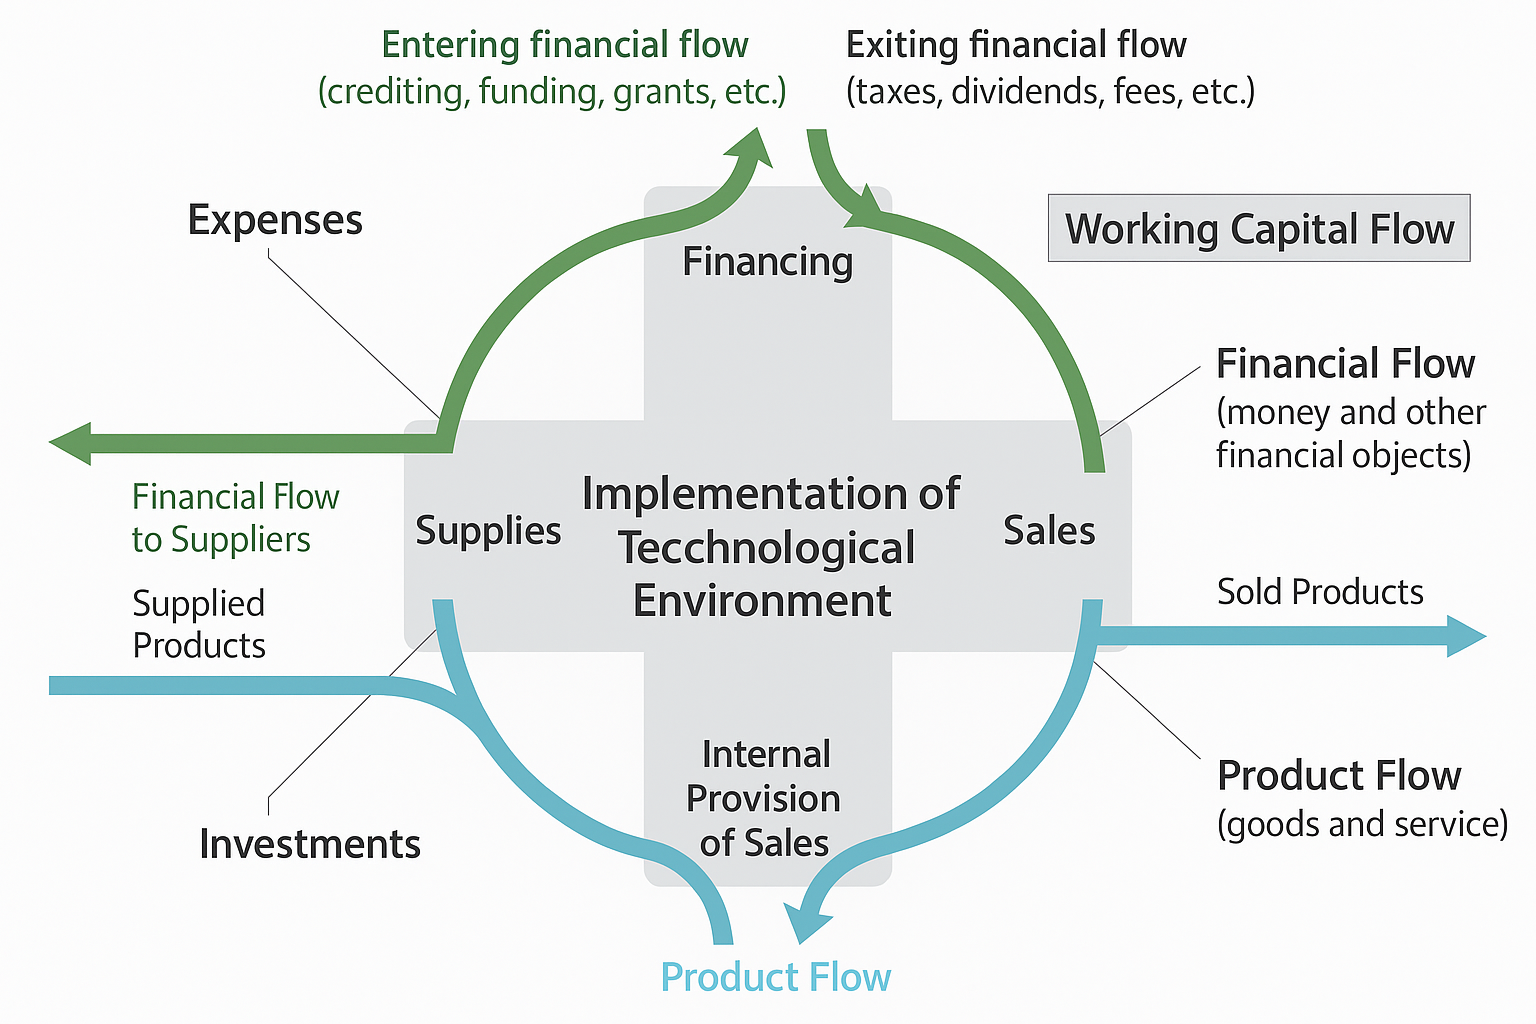
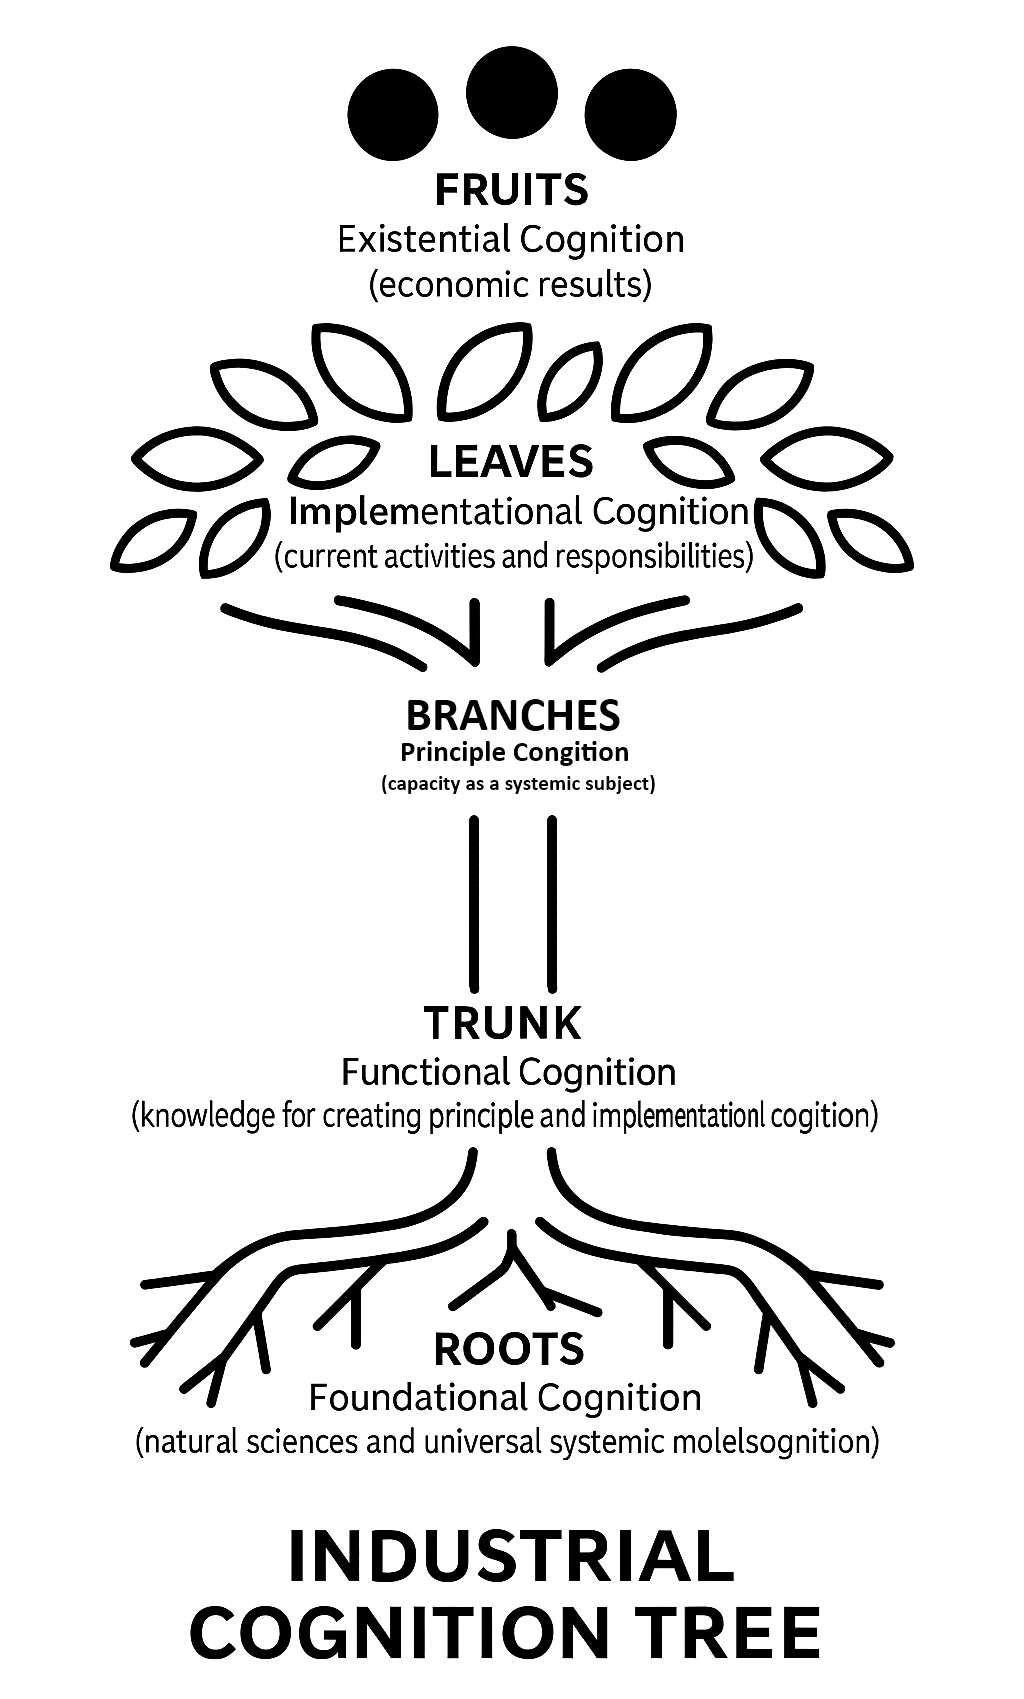
The Business Model Ontology represents a significant advancement in creating mathematically structured representations of business enterprises. This comprehensive framework provides formal knowledge of structural organization, functioning, and necessary cognitions of business enterprises through two primary cognitive platforms. The Industrial Cross explains an enterprise as a systemic object comprised of five technological systems that incorporate numerous specific objects and processes, defining all elements, their relationships, and properties in a way that enables mathematical modeling across strategic, tactical, and operational dimensions. The Industrial Cognition Tree provides comprehensive knowledge management understanding through hierarchically structured enterprise-specific cognitions, explaining an enterprise as a systemic subject possessing cognitions and enabling management of the cognitive base of the enterprise.
This ontological approach creates a foundational mathematical structure that can represent business entities as formal objects with defined properties, relationships, and constraints. The systematic nature of BMO makes it suitable for LLM processing, as it provides clear semantic definitions and logical relationships that can be expressed in formal logic languages.
Financial Industry Business Ontology (FIBO)
The Financial Industry Business Ontology (FIBO) illustrates how complex financial concepts can be precisely structured for machine interpretation. It defines key elements relevant to financial business applications and maps out their interrelationships, enabling data to carry clear, contextual meaning. Built using the Web Ontology Language (OWL) and standardized by the World Wide Web Consortium (W3C), FIBO leverages Description Logic to ensure that every concept is clearly defined and interpretable by both humans and machines.

FIBO’s logical structure makes it suitable for large language model (LLM) processing, offering formal semantic definitions that remove ambiguity from financial terms and relationships. Its concepts, refined over time through review by industry member firms, reflect a shared understanding across the financial sector, providing a solid foundation for rigorous mathematical modeling of financial business systems.
Structured Data Exchange Formats
XBRL Taxonomies for Financial Reporting
XBRL (eXtensible Business Reporting Language) taxonomies represent one of the most mature examples of mathematical structuring for business financial data. These taxonomies function as dictionaries for reporting, providing digital definitions for business concepts and making digital reporting possible through structured tagging systems. Digital reports work by tagging each reported fact so that it can be identified by computer software, with taxonomies defining the tags to be used for each concept to be reported, giving the data digital meaning.
Each financial concept is defined as an element with specific attributes such as data type, period type, and balance type, arranged in hierarchical structures that facilitate logical grouping and navigation. The system includes multiple linkbases that establish various relationships among elements, including presentation linkbases that define how elements are presented in financial reports, calculation linkbases that specify mathematical relationships, and definition linkbases that provide conceptual relationships.
Here’s an example of an IFRS XBRL instance file for a SaaS-based e-commerce shop, that uses realistic elements such as Revenue from Contracts with Customers, Software Development Costs, Hosting Expenses, and Deferred Revenue. This example follows the XBRL 2003 instance structure with IFRS GP 2005 taxonomy:
<?xml version="1.0" encoding="UTF-8"?>
<xbrli:xbrl xmlns:ifrs-gp="http://xbrl.iasb.org/int/fr/ifrs/gp/2005-05-15" xmlns:iso4217="http://www.xbrl.org/2003/iso4217" xmlns:xbrli="http://www.xbrl.org/2003/instance" xmlns:xbrll="http://www.xbrl.org/2003/linkbase" xmlns:xlink="http://www.w3.org/1999/xlink">
<xbrll:schemaRef xlink:href="http://www.example.com/xbrl/taxonomy/saas" xlink:type="simple"/>
<ifrs-gp:Revenue contextRef="FY2024" unitRef="EUR" decimals="0">124000000</ifrs-gp:Revenue> <ifrs-gp:CostOfSales contextRef="FY2024" unitRef="EUR" decimals="0">42000000</ifrs-gp:CostOfSales> <ifrs-gp:ResearchAndDevelopmentExpense contextRef="FY2024" unitRef="EUR" decimals="0">18000000</ifrs-gp:ResearchAndDevelopmentExpense> <ifrs-gp:GeneralAndAdministrativeExpense contextRef="FY2024" unitRef="EUR" decimals="0">12000000</ifrs-gp:GeneralAndAdministrativeExpense> <ifrs-gp:DeferredRevenue contextRef="FY2024" unitRef="EUR" decimals="0">30000000</ifrs-gp:DeferredRevenue> <ifrs-gp:OtherOperatingIncome contextRef="FY2024" unitRef="EUR" decimals="0">2500000</ifrs-gp:OtherOperatingIncome> <ifrs-gp:OtherOperatingExpenses contextRef="FY2024" unitRef="EUR" decimals="0">1600000</ifrs-gp:OtherOperatingExpenses> <ifrs-gp:ProfitLoss contextRef="FY2024" unitRef="EUR" decimals="0">48300000</ifrs-gp:ProfitLoss>
<xbrli:context id="FY2024"> <xbrli:entity> <xbrli:identifier scheme="http://www.example.com/xbrl/entity">SAASSHOP</xbrli:identifier> </xbrli:entity> <xbrli:period> <xbrli:startDate>2024-01-01</xbrli:startDate> <xbrli:endDate>2024-12-31</xbrli:endDate> </xbrli:period> </xbrli:context>
<xbrli:unit id="EUR"> <xbrli:measure>iso4217:EUR</xbrli:measure> </xbrli:unit>
</xbrli:xbrl>
XBRL taxonomies demonstrate how complex financial information can be transformed from narrative formats into structured, machine-readable formats that maintain semantic meaning while enabling precise computational analysis. The standardized framework ensures that financial data is consistently categorized and understood across different systems and stakeholders, enabling seamless data exchange and comparability.
Financial Products Markup Language (FpML)
FpML represents another example of mathematical structuring for business information exchange. As a business information exchange standard based on Extensible Markup Language (XML), FpML enables business-to-business over-the-counter financial derivative transactions online by following W3C standards. The standard covers core processes including trading, valuation, confirmation, novation, increase, amendment, termination, allocation, position reporting, and cash flow matching.
Below you can see an example of an FpML (Financial products Markup Language) document representing an interest rate swap between two counterparties. This example demonstrates key elements in an FpML 5.x structure, simplified for readability.
<?xml version="1.0" encoding="UTF-8"?>
<fpml:trade xmlns:fpml="http://www.fpml.org/FpML-5/confirmation" xmlns:xsi="http://www.w3.org/2001/XMLSchema-instance" xsi:schemaLocation="http://www.fpml.org/FpML-5/confirmation https://www.fpml.org/spec/fpml-5-10-4-wd-1/xsd/confirmation/fpml-main-5-10.xsd">
<fpml:tradeHeader> <fpml:partyTradeIdentifier> <fpml:partyReference href="Party1"/> <fpml:tradeId tradeIdScheme="http://www.saasfx.com/trade-id">SWAP123456</fpml:tradeId> </fpml:partyTradeIdentifier> <fpml:partyTradeIdentifier> <fpml:partyReference href="Party2"/> <fpml:tradeId tradeIdScheme="http://www.tradereportinghub.com/trade-id">SWAP987654</fpml:tradeId> </fpml:partyTradeIdentifier> <fpml:tradeDate>2025-06-10</fpml:tradeDate> </fpml:tradeHeader>
<fpml:swap> <fpml:swapStream> <fpml:payerPartyReference href="Party1"/> <fpml:receiverPartyReference href="Party2"/> <fpml:calculationPeriodDates> <fpml:effectiveDate> <fpml:unadjustedDate>2025-06-12</fpml:unadjustedDate> </fpml:effectiveDate> <fpml:terminationDate> <fpml:unadjustedDate>2028-06-12</fpml:unadjustedDate> </fpml:terminationDate> </fpml:calculationPeriodDates> <fpml:paymentDates> <fpml:paymentFrequency> <fpml:periodMultiplier>6</fpml:periodMultiplier> <fpml:period>M</fpml:period> </fpml:paymentFrequency> </fpml:paymentDates> <fpml:calculationPeriodAmount> <fpml:notionalSchedule> <fpml:notionalStepSchedule> <fpml:initialValue>10000000</fpml:initialValue> <fpml:currency>EUR</fpml:currency> </fpml:notionalStepSchedule> </fpml:notionalSchedule> <fpml:calculation> <fpml:fixedRateSchedule> <fpml:initialValue>0.015</fpml:initialValue> </fpml:fixedRateSchedule> <fpml:dayCountFraction>30/360</fpml:dayCountFraction> </fpml:calculation> </fpml:calculationPeriodAmount> </fpml:swapStream>
<fpml:swapStream> <fpml:payerPartyReference href="Party2"/> <fpml:receiverPartyReference href="Party1"/> <fpml:calculationPeriodDates> <fpml:effectiveDate> <fpml:unadjustedDate>2025-06-12</fpml:unadjustedDate> </fpml:effectiveDate> <fpml:terminationDate> <fpml:unadjustedDate>2028-06-12</fpml:unadjustedDate> </fpml:terminationDate> </fpml:calculationPeriodDates> <fpml:paymentDates> <fpml:paymentFrequency> <fpml:periodMultiplier>6</fpml:periodMultiplier> <fpml:period>M</fpml:period> </fpml:paymentFrequency> </fpml:paymentDates> <fpml:calculationPeriodAmount> <fpml:notionalSchedule> <fpml:notionalStepSchedule> <fpml:initialValue>10000000</fpml:initialValue> <fpml:currency>EUR</fpml:currency> </fpml:notionalStepSchedule> </fpml:notionalSchedule> <fpml:calculation> <fpml:floatingRateCalculation> <fpml:floatingRateIndex>EUR-EURIBOR-6M</fpml:floatingRateIndex> <fpml:indexTenor> <fpml:periodMultiplier>6</fpml:periodMultiplier> <fpml:period>M</fpml:period> </fpml:indexTenor> </fpml:floatingRateCalculation> <fpml:dayCountFraction>ACT/360</fpml:dayCountFraction> </fpml:calculation> </fpml:calculationPeriodAmount> </fpml:swapStream> </fpml:swap>
<fpml:party id="Party1"> <fpml:partyId>saasfx-ltd</fpml:partyId> <fpml:partyName>SaaS FX Ltd</fpml:partyName> </fpml:party> <fpml:party id="Party2"> <fpml:partyId>capitalbank-ag</fpml:partyId> <fpml:partyName>CapitalBank AG</fpml:partyName> </fpml:party>
</fpml:trade>
By utilizing well-known XML standard FpML makes it reasonably easy to understand and implement by developers. The standard includes formal definition of party roles and trade notification mechanisms, creating a comprehensive mathematical framework for representing financial derivative transactions. This standardization eliminates ambiguity and enables precise computational processing of complex financial relationships.
Visual and Analytical Business Frameworks
Business Model Canvas Mathematical Structure
The Business Model Canvas (BMC) provides a systematic framework for representing business models. The canvas consists of nine building blocks that represent key aspects of business models: customer segments, value propositions, channels, customer relationships, revenue streams, key resources, key activities, key partnerships, and cost structure. Each block represents a specific dimension of the business model with defined relationships and dependencies. Similar is actually true for Lean Canvas and I have described differences between LC and BMC in the past.
While both are visual tables (not mathematical per-se) data structures, their potential lies in its systematic decomposition of business models into discrete, quantifiable components. Each of the blocks can be represented as text data with specific attributes, relationships, and constraints (so essentially what you would do to make it more comprehensive by AI is to add a bit more relations layer to it). Customer segments can be mathematically defined through demographic, behavioral, and preference variables. Value propositions can be quantified through benefit metrics and customer value calculations. Revenue streams can be expressed through mathematical formulas relating pricing models, volume projections, and cost structures.
The visual framework of the BMC could be potentially used as input (ex. as image) to be processed by AI. Although by using image you are risking few things:
- it is hader for AI to interpret image than structural data, so do expect some data distortions or half-truths
- it is harder to represet all realtions between elements and specific financial data on image (such as demography or relation between client and channel). And the more complicated image, the more of AD1.
So instead you could translate this tabelarized data to XML or JSON. Such transformed data structure of BMC model could look like this:
{
  "businessModelCanvas": {
    "customerSegments": [
      {
        "id": "cs1",
        "name": "Entrepreneurs who want to build SaaS software",
        "type": "primary_target"
      }
    ],
    "valuePropositions": [
      {
        "id": "vp1",
        "name": "Help with learning (workshops, blog)",
        "targetSegments": ["cs1"],
        "type": "educational_support"
      },
      {
        "id": "vp2",
        "name": "MVP for early users",
        "targetSegments": ["cs1"],
        "type": "product_development"
      },
      {
        "id": "vp3",
        "name": "User-Based Development",
        "targetSegments": ["cs1"],
        "type": "custom_development"
      }
    ],
    "channels": [
      {
        "id": "ch1",
        "name": "Google Search Results",
        "type": "digital_marketing",
        "relatedActivities": ["ka1"]
      },
      {
        "id": "ch2",
        "name": "LinkedIn",
        "type": "social_media",
        "relatedRelationships": ["cr2"]
      }
    ],
    "customerRelationships": [
      {
        "id": "cr1",
        "name": "Direct contact after clicking Contact Us",
        "type": "direct_support",
        "channels": ["ch1"]
      },
      {
        "id": "cr2",
        "name": "Direct contact through LinkedIn",
        "type": "social_engagement",
        "channels": ["ch2"]
      }
    ],
    "revenueStreams": [
      {
        "id": "rs1",
        "name": "Maintenance of existing systems",
        "type": "recurring_revenue",
        "relatedActivities": ["ka2"]
      },
      {
        "id": "rs2",
        "name": "Per-Hour Development",
        "type": "service_revenue",
        "relatedActivities": ["ka2"]
      }
    ],
    "keyResources": [
      {
        "id": "kr1",
        "name": "Stable Server Architecture",
        "type": "technological",
        "supportedActivities": ["ka1", "ka2"]
      },
      {
        "id": "kr2",
        "name": "Experienced Developers",
        "type": "human",
        "supportedActivities": ["ka2"],
        "relatedCosts": ["co2"]
      }
    ],
    "keyActivities": [
      {
        "id": "ka1",
        "name": "Automat Deployment (CI/CD)",
        "type": "technological_process",
        "requiredResources": ["kr1"],
        "supportedValueProps": ["vp2"]
      },
      {
        "id": "ka2",
        "name": "Development",
        "type": "core_service",
        "requiredResources": ["kr1", "kr2"],
        "supportedValueProps": ["vp2", "vp3"],
        "generatesRevenue": ["rs1", "rs2"]
      }
    ],
    "keyPartnerships": [
      {
        "id": "kp1",
        "name": "Some Strategic Partner",
        "type": "strategic_alliance",
        "purpose": "business_expansion"
      },
      {
        "id": "kp2",
        "name": "Some Strategic Client",
        "type": "key_customer",
        "purpose": "revenue_generation",
        "relatedRevenue": ["rs1", "rs2"]
      }
    ],
    "costStructure": [
      {
        "id": "co1",
        "name": "Server structure",
        "type": "infrastructure_cost",
        "relatedResources": ["kr1"]
      },
      {
        "id": "co2",
        "name": "Salaries",
        "type": "personnel_cost",
        "relatedResources": ["kr2"]
      },
      {
        "id": "co3",
        "name": "Accounting",
        "type": "operational_cost"
      }
    ],
    "businessModelType": "B2B Service Provider",
    "legend": {
      "cashflow": "teal",
      "clientEntrepreneurs": "yellow"
    },
    "relationships": {
      "valueChain": {
        "from": "customerSegments",
        "through": ["valuePropositions", "channels", "customerRelationships"],
        "to": "revenueStreams"
      },
      "operationalChain": {
        "from": "keyResources",
        "through": "keyActivities",
        "to": "valuePropositions"
      },
      "costRevenueLinkage": {
        "costs": ["co1", "co2", "co3"],
        "revenues": ["rs1", "rs2"],
        "profitability": "dependent_on_efficiency"
      }
    }
  }
}
Note that this is not standardized in any way. For simple AI use it should be comprehesive to understand, but if you are thinking about wider use (such as automatic data reporting between departments and representing relations between them) it might probably be good idea to document whole structure.
Just imagine the possibilities that translates to ability for LLM to process more efficiently than narrative business plans. The interconnected nature of the nine blocks creates a representation that can be expressed logically, enabling computational analysis of business model viability, optimization opportunities, and strategic alternatives.
Balanced Scorecard as Mathematical Framework
The Balanced Scorecard (BSC) represents an approach to business strategy performance measurement that extends beyond traditional financial metrics and is widely used by managers. The framework examines organizations from four different perspectives:
- Financial (or Stewardship) – for example “Our goal is to increase quarterly net profit margins by 5% through cost optimization and pricing strategy.“
- Customer/Stakeholder – for example “We aim to improve customer satisfaction scores by 10% by enhancing our support response time and personalization.“
- Internal Process – for example “By automating our order fulfillment workflow, we plan to reduce processing time from 48 hours to 24 hours.“
- Organizational Capacity (Learning & Growth) – for example “We will launch a continuous learning program to increase employee digital skills and drive innovation readiness.“
Notice how each KPI attempts to establish goal that is SMART!
Each perspective includes strategic objectives, performance measures (KPIs), targets, and initiatives that can be mathematically defined and tracked.
To make it “mathematical”, we can simply add some rules for and scoring. For example we can establish, that:
- there are 4 Perspectives: Financial (F), Customer (C), Internal Process (P), Learning & Growth (L)
- Each perspective has a weight (importance) and a performance score (0–100)
- Overall score = weighted sum of perspective scores
So quarterly performance table could look like this:
| Perspective | Weight | Performance Score |
|---|---|---|
| Financial (F) | 0.30 | 80 |
| Customer (C) | 0.25 | 70 |
| Internal Process (P) | 0.25 | 60 |
| Learning & Growth (L) | 0.20 | 90 |
And by applying simple algebra we can calculate Balanced Scorecard Performance Index = 74.5 / 100, which can be tracked over time or compared across departments/strategies to assess strategic performance quantitatively.
The structure of the BSC makes it easy for LLM to process through its systematic approach to performance measurement and throuhg precise definitions of each object. Strategic objectives are broken down into actionable steps that can be quantified through specific KPIs, creating measurable connections between abstract strategic concepts and concrete operational metrics. Such approach can be implemented as part of EBM (Evidence-Based Management) or tool for EBM. Strategy maps provide visual representations of logical, cause-and-effect connections between strategic objectives, creating mathematical relationships that can be expressed as formal dependencies and influence networks.
The BSC’s evolution into a holistic system for managing strategy demonstrates how qualitative strategic concepts can be transformed into quantitative frameworks suitable for computational analysis. The disciplined framework provides organizations with a way to “connect the dots” between various components of strategic planning and management, creating visible connections between projects, measurements, strategic objectives, and organizational mission that can be mathematically modeled.
SAFe for Lean Enterprises
While not mathematical model by desin, I wouldn’t be myself if I didn’t mention this one as Agile enthusiast. The Scaled Agile Framework (SAFe) for Lean Enterprises provides a structured and highly organized approach to scaling Lean, Agile, and DevOps practices across large organizations. SAFe is built on core Lean-Agile principles, including taking an economic view, applying systems thinking, assuming variability while preserving options, building incrementally with fast learning cycles, and organizing around value. These principles are designed to guide decision-making, foster alignment, and optimize value delivery across complex organizational structures.
SAFe’s architecture is defined by four hierarchical configurations—Essential SAFe, Large Solution SAFe, Portfolio SAFe, and Full SAFe—each offering a standardized set of roles, responsibilities, and processes tailored to different business scales and complexities. At its core, SAFe uses constructs like Agile Release Trains (ARTs), value streams, and program increments, which can be represented as mathematical models or structured data flows. These constructs facilitate the visualization and management of dependencies, work-in-progress, and value delivery, supporting objective evaluation through metrics such as lead time, batch size, and cost of delay.
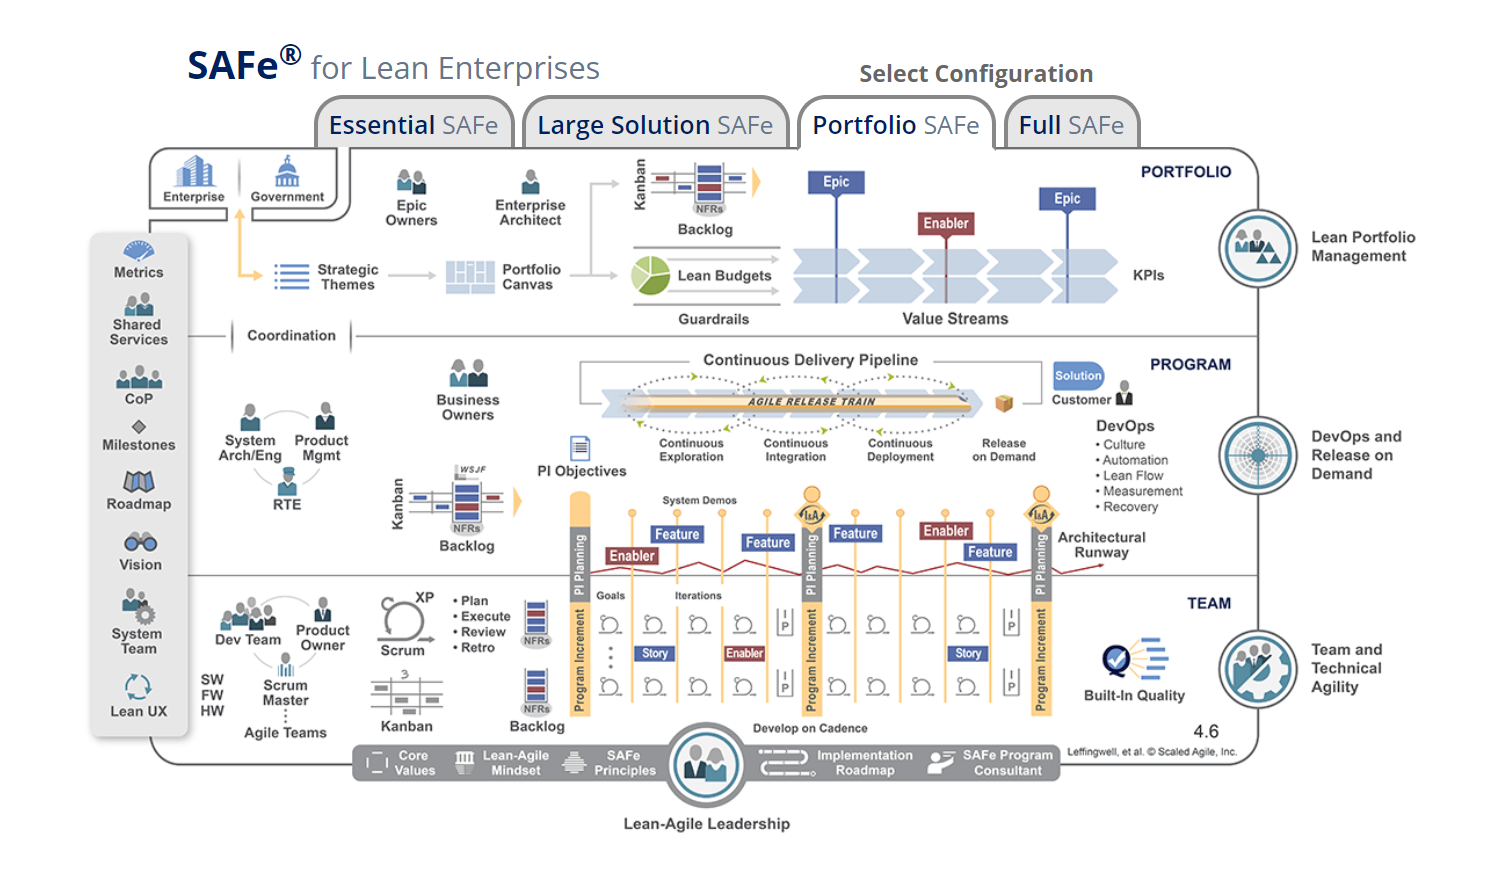
SAFe emphasizes transparency, built-in quality, and decentralized decision-making, all of which can be formalized in process models and data schemas that are well-suited for analysis by large language models (LLMs) – especially if you attempt to standardize organization data in XML or JSON structure. By defining clear relationships between teams, value streams, and portfolio-level initiatives, SAFe enables organizations to represent strategy, execution, and financials in a structured, machine-readable manner. This mathematical rigor, combined with its focus on continuous improvement and alignment, makes SAFe a powerful template for both human and AI-driven understanding of enterprise organization and performance.
Process and System Modeling Approaches
Petri Net Business Process Models
Petri nets provide a formal mathematical framework for modeling business processes. This approach uses well-established theory for capturing and analyzing models with concurrency, providing precise semantics that make it ideal for explaining foundational concepts and enabling computational analysis. The formal method offers distinct advantages for modeling processes over industrial modeling languages found in other approaches.
The mathematical foundation of Petri nets makes them suitable for LLM processing, as they provide formal definitions of process states, transitions, and conditions. The precise semantics enable computational verification of process properties, detection of design flaws, and analysis of process behavior under various conditions. The simplicity and expressiveness of Petri nets make them ideal for representing complex business processes in mathematically rigorous ways that can be computationally analyzed.
System Dynamics for Business Strategy
System Dynamics provides a mathematical framework for modeling complex business systems that accounts for feedback loops, delays, and non-linear relationships. This approach enables organizations to build models that simulate the impact of different business variables such as customer demand, marketing efforts, and pricing, providing clearer understanding of how short- and long-term strategies affect performance. Unlike static or linear models, System Dynamics accounts for feedback loops and delays, making it more suited for complex, real-world business environments. This approach also makes it more suitable for fast-changing busniesses or businesses operating in variable environment.
The mathematical nature of System Dynamics makes it highly compatible with LLM processing, as it transforms qualitative business relationships into quantitative differential equations and feedback structures. The approach identifies three core customer behaviors as primary drivers of business outcomes: customer acquisition, retention, and increased purchase rates, each of which can be mathematically modeled with specific variables and relationships. The framework enables modeling of pricing elasticity, marketing funnel dynamics, and product lifecycle management through mathematical representations that capture complex interdependencies.
Graph Frameworks and Tools
ArchiMate Enterprise Architecture Framework
ArchiMate is an open, independent modeling language designed for enterprise architecture. It supports the clear and consistent description, analysis, and visualization of architectures across various business domains. Developed as a technical standard by The Open Group, ArchiMate builds on principles from the now-retired IEEE 1471 standard, offering a structured approach to representing complex enterprise systems.
ArchiMate provides a formal modeling language for enterprise architecture that creates representations of organizational structure and relationships. It provides instruments to support enterprise architects in describing, analyzing, and visualizing relationships among business domains in unambiguous ways. The framework enables high-level modeling within domains and representation of relationships between domains.
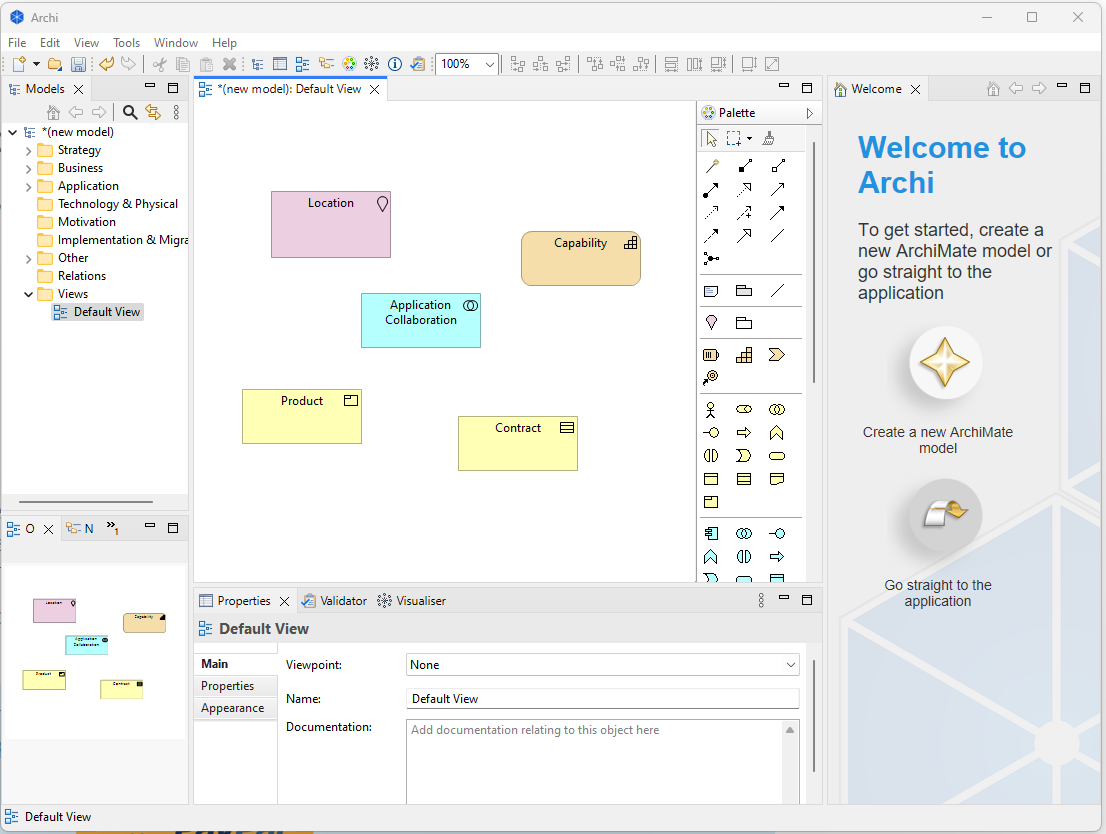
The standard includes specific elements for business, application, and technology layers, with defined relationships and properties that can be mathematically expressed. So while ArchiMate is a tool, not a data structure, it can be used to export data for example to Open Exchange Format. Exporting data enables computational analysis of enterprise architecture complexity, dependency analysis, and impact assessment of architectural changes. Due to program complexity though it is good idea to start with some ArchiMate templates.
Business Process Model Notation (BPMN)
Business Process Model Notation provides a standardized visual language for representing business processes that can be transformed into mathematical models suitable for LLM processing. BPMN diagrams use standardized symbols for tasks, events, gateways, and swimlanes that can be mathematically represented as state machines or process algebras. The standardized format ensures consistency and reduces errors in process mapping while providing a universal visual language for both business and technical teams.
This is NOT the same as ArchiMate, as ArchiMate does not use BPMN directly within its own notation, but the two can be—and often are—used together. ArchiMate provides the architectural context and high-level process mapping, while BPMN delivers the detailed process flows. Integration between the two enables organizations to achieve both architectural oversight and operational detail.
| Aspect | ArchiMate | BPMN |
| Primary Focus | Enterprise architecture (high-level) | Detailed business process modeling |
| Process Modeling | Abstract, high-level (existence only) | Detailed, step-by-step flow |
| Integration | Can link to BPMN for detail | Can be referenced from ArchiMate |
| Typical Use Case | Architects, strategic planning | Process analysts, workflow design |
The formal structure of BPMN makes it highly compatible with LLM processing (after exporting graph to structured data), as each element type has defined semantics and behavior that can be mathematically modeled. Process flows can be represented as directed graphs with nodes representing activities and edges representing transitions, enabling computational analysis of process efficiency, bottlenecks, and optimization opportunities.
Implementation Considerations and Schema Structures
JSON Schema for Business Data
JSON Schema provides a powerful framework for creating structured, machine-readable representations of business data that are exceptionally well-suited for LLM processing. The schema system enables formal definition of data structures, validation rules, and relationships that can represent various business domains including addresses, financial records, user profiles, and organizational structures. The flexibility of JSON Schema allows for dynamic schema selection based on specific business contexts, making it adaptable to various business modeling needs.
The mathematical precision of JSON Schema makes it ideal for LLM processing, as it provides formal definitions of data types, constraints, and relationships. Schemas can enforce specific business rules through validation constraints, ensuring data consistency and enabling automated processing. The hierarchical nature of JSON Schema enables representation of complex business relationships while maintaining computational efficiency.
XML for Business Processing
XML structured data is highly effective for representing relationships within a business context, making it well-suited for AI processing. Its hierarchical, tag-based format allows for the clear and explicit definition of entities, attributes, and their interdependencies, enabling machines to interpret complex business structures and workflows with precision. XML’s self-describing nature ensures that contextual metadata is embedded directly within the data, which enhances semantic understanding and interoperability across systems. When used as a foundation for AI applications—especially those involving knowledge extraction, rule-based reasoning, or ontology alignment—XML provides a consistent and machine-readable structure that supports accurate interpretation, validation, and integration of business logic and relationships.
Vector Storage for Better AI Processing
Vector storage is an ideal solution for storing business data that needs to be processed by AI and large language models (LLMs), as it enables efficient handling of unstructured or semi-structured information such as documents, emails, customer interactions, and knowledge bases. By converting this data into high-dimensional vector embeddings, vector storage allows for fast and accurate semantic search, similarity matching, and contextual understanding—key capabilities for LLM-driven applications. This approach supports more intelligent querying, retrieval-augmented generation (RAG), and advanced analytics, making it especially valuable for use cases like customer support automation, knowledge discovery, and personalized recommendations within business environments.
Such medium can also be used as supplementary medium to default business process description, so it should not be underestimated, as it may greatly improve overall outcomes and simlulatins quality.
Conclusion and How to Get Started
The transformation of qualitative business information into mathematically structured, machine-readable formats represents a critical evolution in business modeling that significantly enhances LLM processing capabilities. The frameworks examined demonstrate various approaches to this transformation, from ontological models like BMO and FIBO that provide formal semantic foundations, to structured data formats like XBRL and FpML that enable precise financial modeling, to analytical frameworks like BSC and System Dynamics that quantify strategic relationships. So you may noticed by now that usage of one method does not exclude you from using another method, and that data exported from different models can give AI different perspectives on busniess, which in result should improve digital busniess model.
While it sounds like a sophisticated matter that requires a lot of time, currently with help of AI tools you can start business analysis early. Maybe a good starting point would be to rewrite your SAFe or Business Model Canvas into XML or JSON, then improve your model by further defining relations between objects, and then pushing your emails, financial data and communication into vector database. Such preparation will not get you a full “digital twin”, but could possibly be used to further improve your business model, ask LLM about strategy or how some recent (or imagined) events may impact your business. Hopefully, even attempts to do so will result in you better understanding your busniess and relations within business, which will help you to facilitate and improve your business overall.